One of the most important tasks for an Oracle DBA is understanding where database time is consumed. In Oracle 19c, performance is typically analyzed using:
- Wait events (
v$system_event) - Event classification (
v$event_name) - CPU usage (
v$sys_time_model)
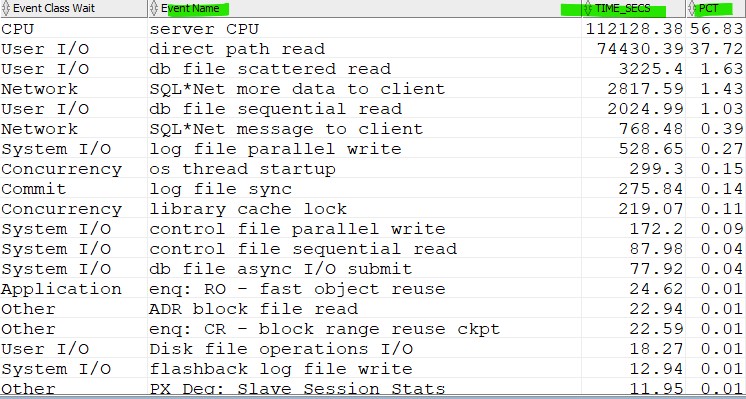
The following query provides a complete breakdown of database time consumption, including both:
- Wait classes (I/O, Concurrency, Network, etc.)
- CPU usage (DB CPU + background CPU)
This query helps answer a critical question:
“Is my database slow because of CPU or because of waits?”
It provides:
- Total time spent per event
- Percentage contribution of each event
- Clear separation of CPU vs wait events
- Exclusion of idle wait events
SELECT wait_class "Event Class Wait",
       NAME "Event Name",
       ROUND(time_secs, 2) time_secs,
       ROUND(time_secs * 100 / SUM(time_secs) OVER (), 2) pct
FROM (
    /* Wait events */
    SELECT n.wait_class,
           e.event NAME,
           e.time_waited / 100 time_secs
    FROM v$system_event e,
         v$event_name n
    WHERE n.name = e.event
      AND n.wait_class <> 'Idle'
      AND e.time_waited > 0

    UNION

    /* CPU usage */
    SELECT 'CPU',
           'server CPU',
           SUM(value / 1000000) time_secs
    FROM v$sys_time_model
    WHERE stat_name IN ('background cpu time', 'DB CPU')
)
ORDER BY time_secs DESC;
How it works
1. Wait events analysis
The first part reads:
v$system_event: total wait time per eventv$event_name: classification of events into wait classes
It filters out:
- Idle events (e.g. SQL*Net message from client)
This ensures only real performance-impacting waits are included.
2. CPU consumption
The second part adds CPU usage using:
DB CPU→ time spent executing SQLbackground cpu time→ internal Oracle processes
This is extracted from v$sys_time_model, which provides high-precision time accounting.
3. Unified view
The UNION combines:
- Wait time (I/O, concurrency, network, etc.)
- CPU time
So you get a full 360° performance view.
4. Percentage calculation
time_secs * 100 / SUM(time_secs) OVER ()This shows:
- Contribution of each event to total database time
- Helps quickly identify dominant bottlenecks
Conclusion
This query is a fast DBA diagnostic tool for Oracle 19c performance troubleshooting. It provides a clear breakdown of:
- Where DB time is spent
- Whether the bottleneck is CPU or waits
- Which event class dominates the system
 Google+
 Facebook